My Mario Kart 8 Deluxe Adventure

hello there
![]()
In february 2024, i’ve started playing Mario Kart 8 Deluxe online: it’s fun to run against bots and complete the full solo campaign but it’s even more fun to compete against real humans, stronger and stronger as you become better yourself.
Note
i’ll be posting regular updates on that page to make sure the VR plots are up to date!
As a kind of scientific experiment, i’ve started recording my points after each race. In fact, i was just curious to see what the shape of the resulting curve would look like over time 😋
My personal leaderboard⌗
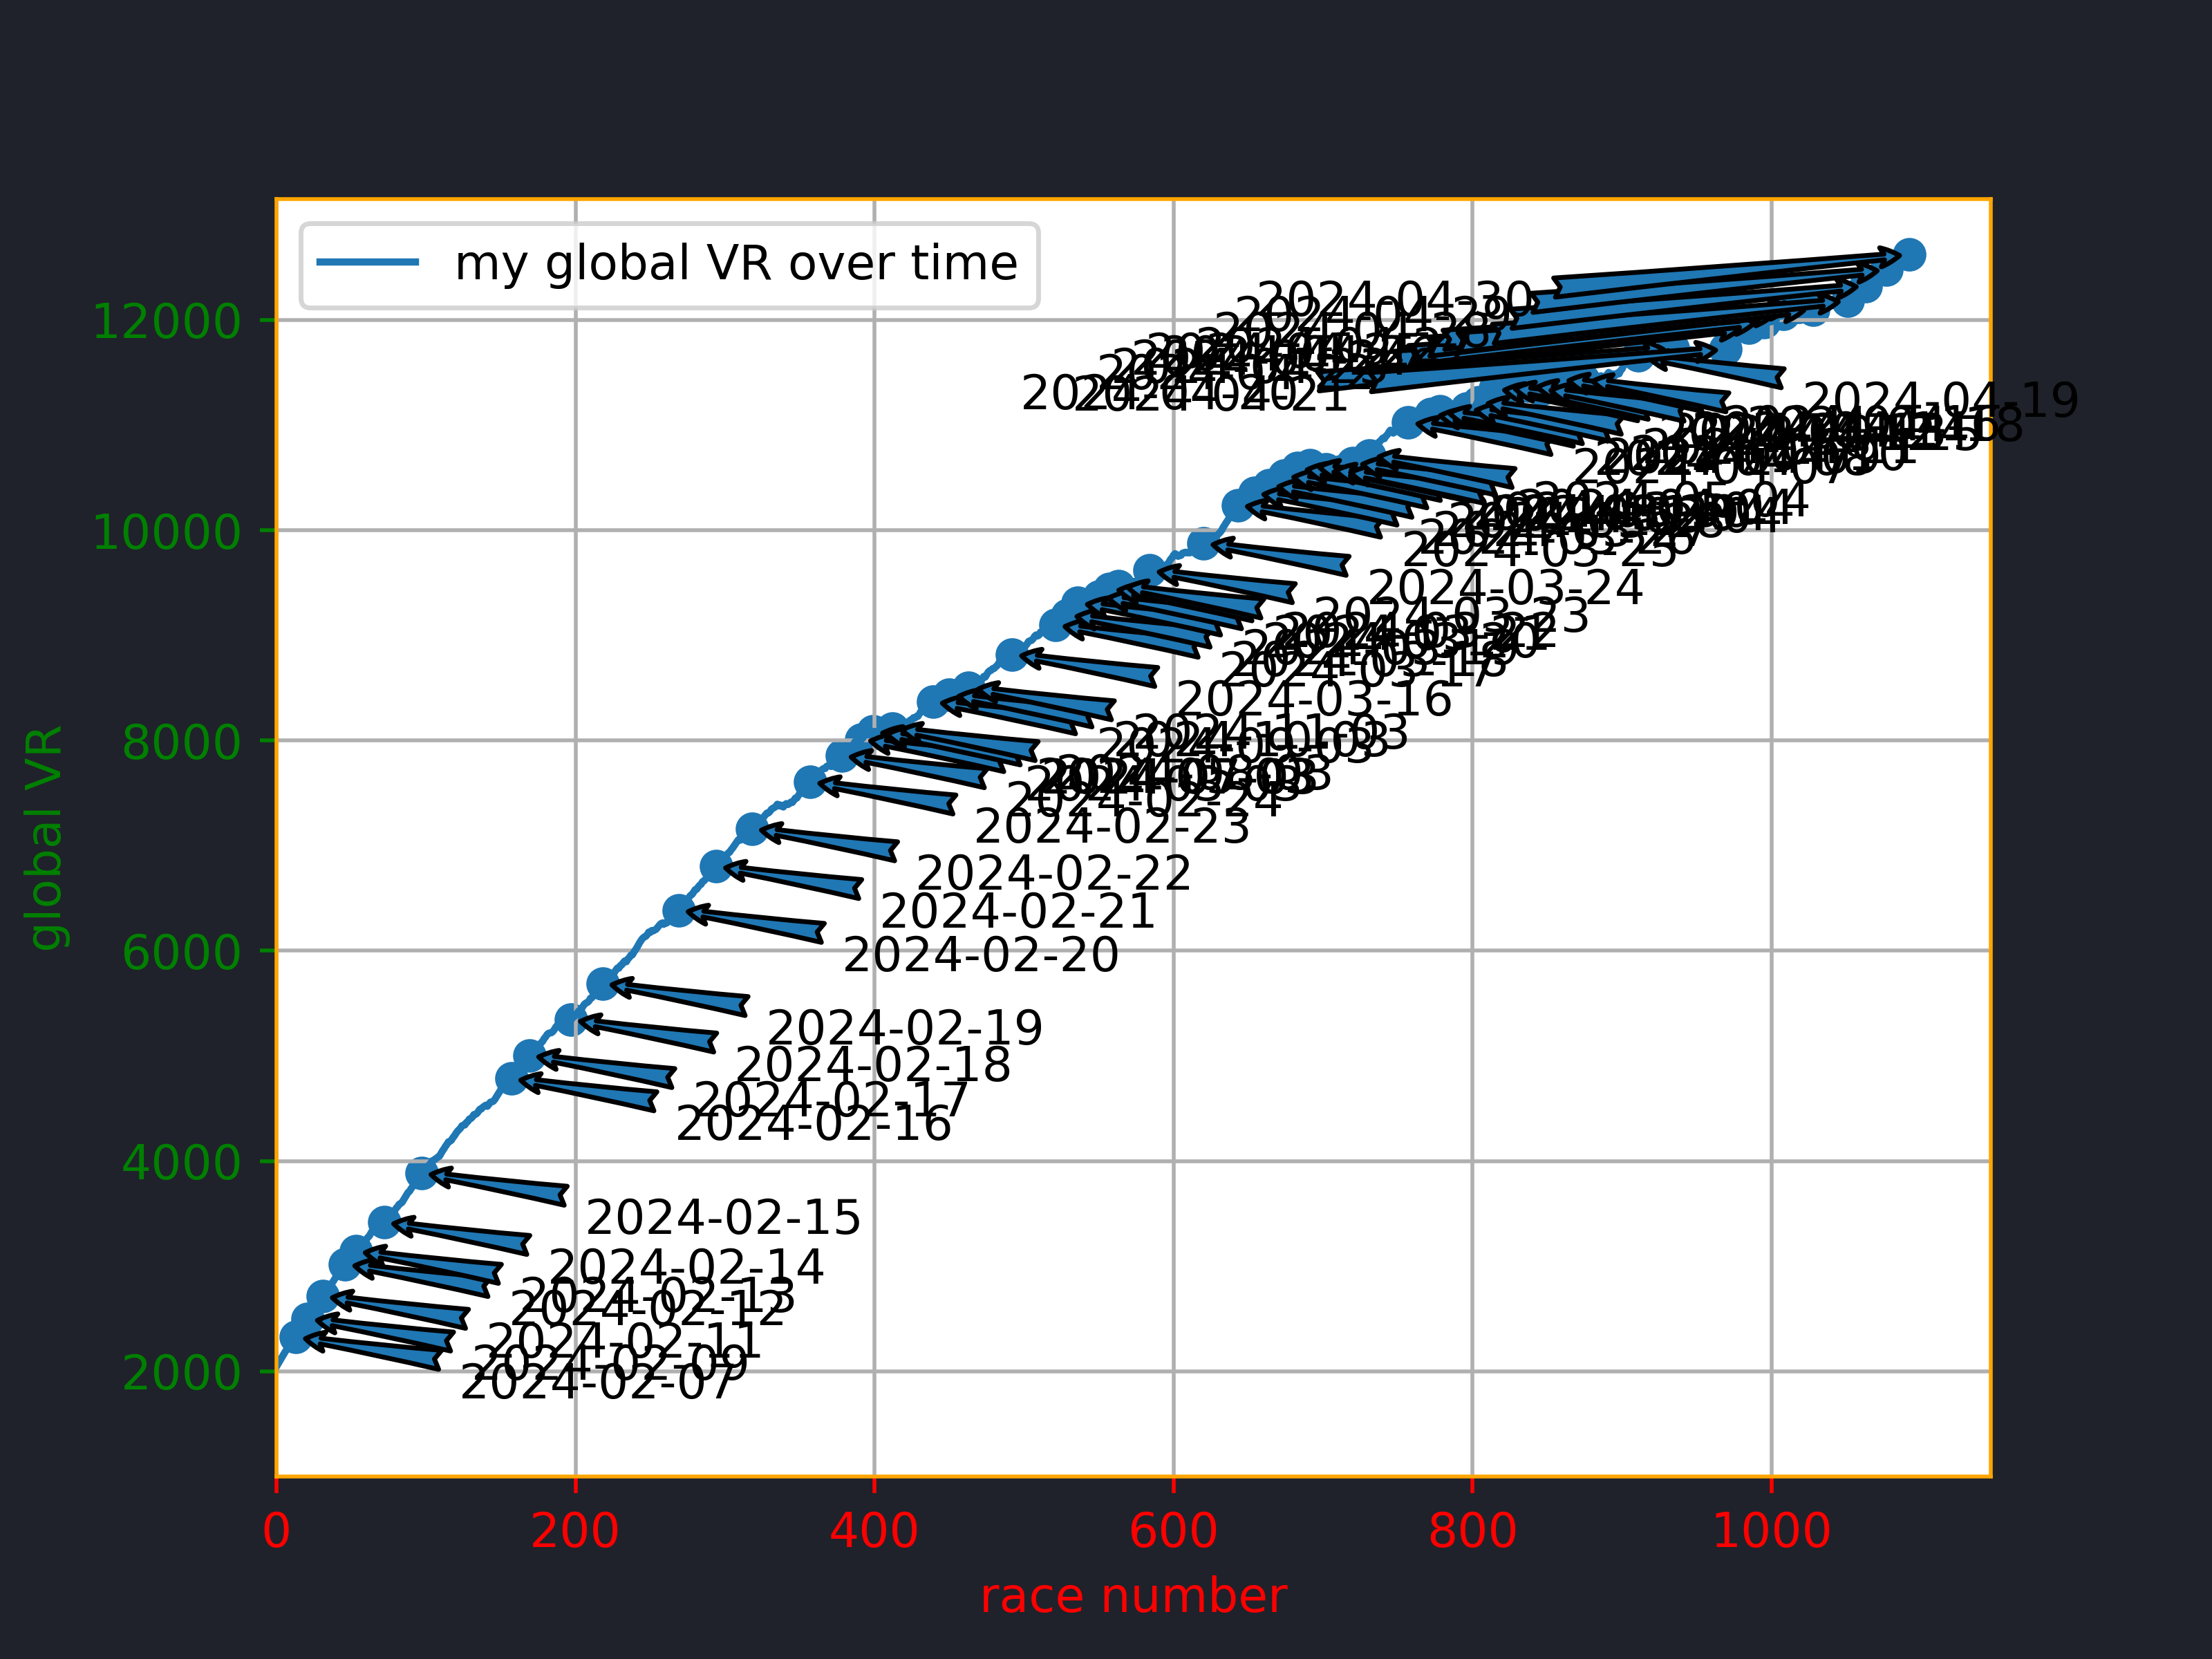
One might notice that the range of points a player can earn after each course is not centered around 0. In fact, as far as i know, the possible values range from around 26 when winning a race to -13 when losing.
What happens to the global VR graph when we try to rectify the possible values a point delta can take?
Normalizing⌗
The first naive method would be to normalize the deltas so that the
distribution of values, between 26 and -13, becomes a normal distribution with
mean 0 and standard deviation 1:
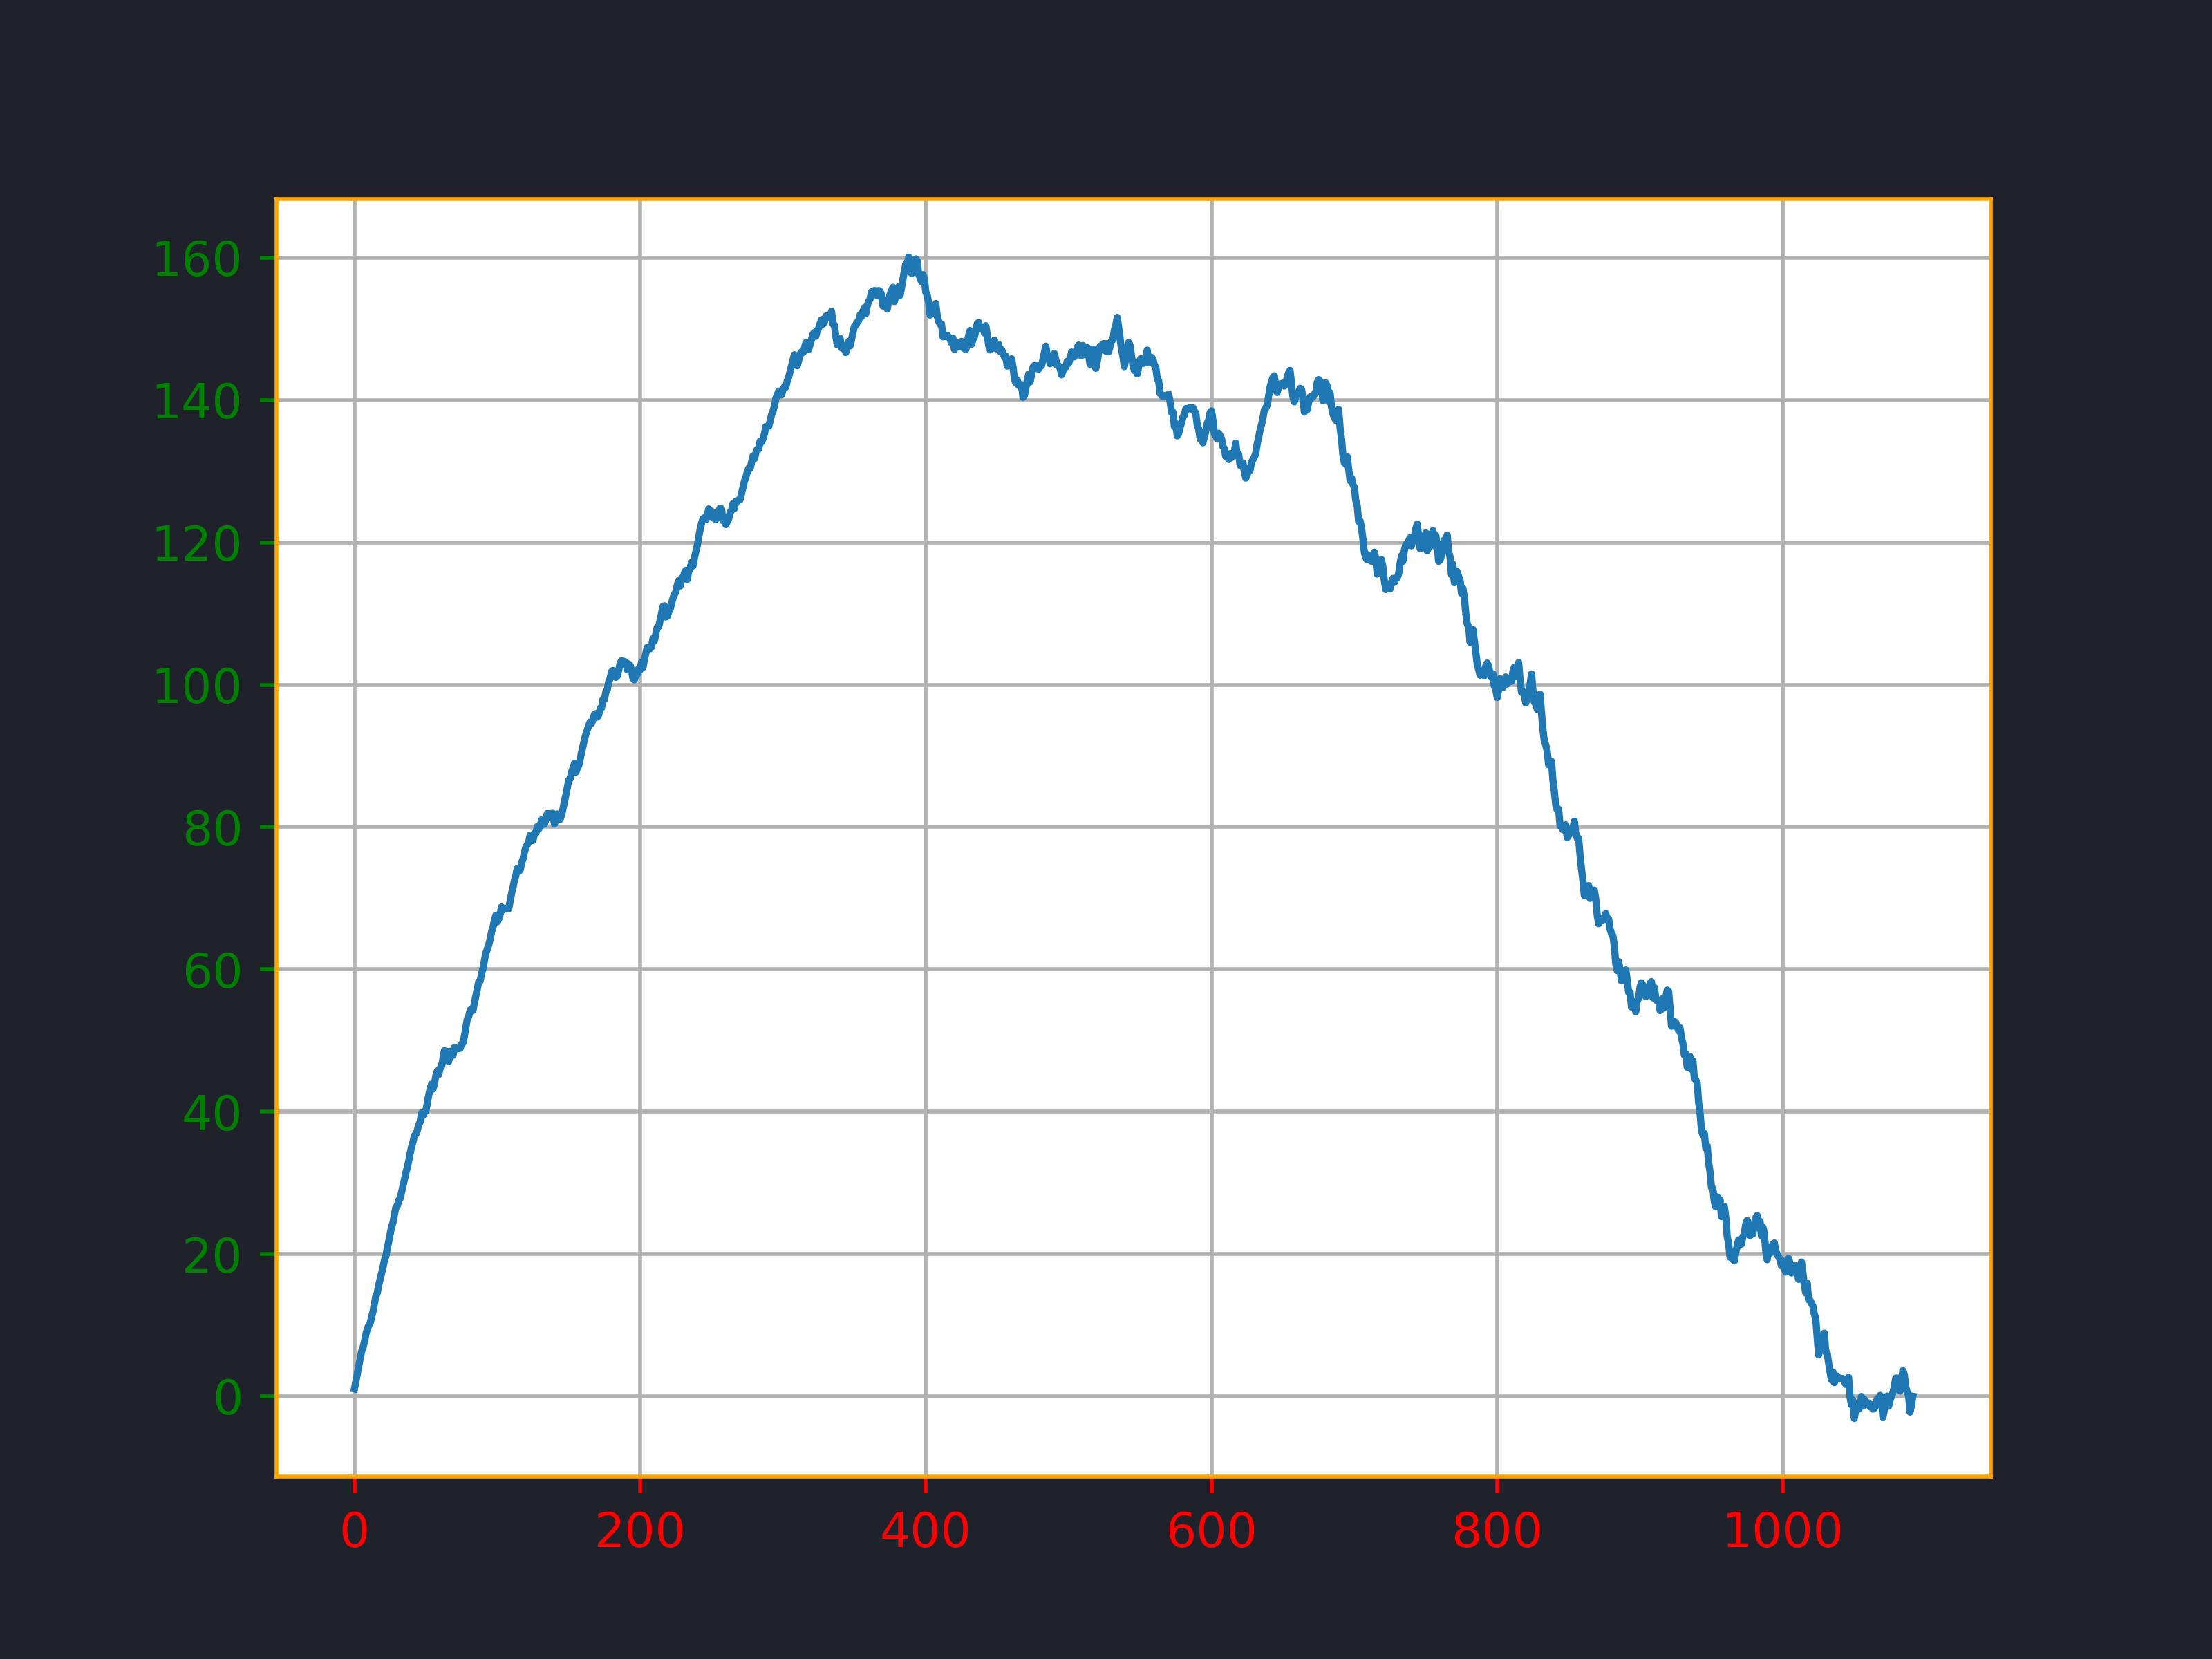
The biggest and immediate flaw with that is that, as the deltas become evenly distributed around 0, the overall VR graph stays near 0 🤔
However, we can see a few things
- there has been a steep improvement with the first 50 races
- then there is a plateau until around the 120th race
- then there is a negative slope, probably some hard times lol
- finally the start of another plateau?
Rectifying⌗
Another idea would be to rectify the deltas. By that i mean, as i know their
possible values range from around 26 to -13, it’s quite easy to just shift and
squeeze them inside the range from -1 to 1 and see what it looks like:
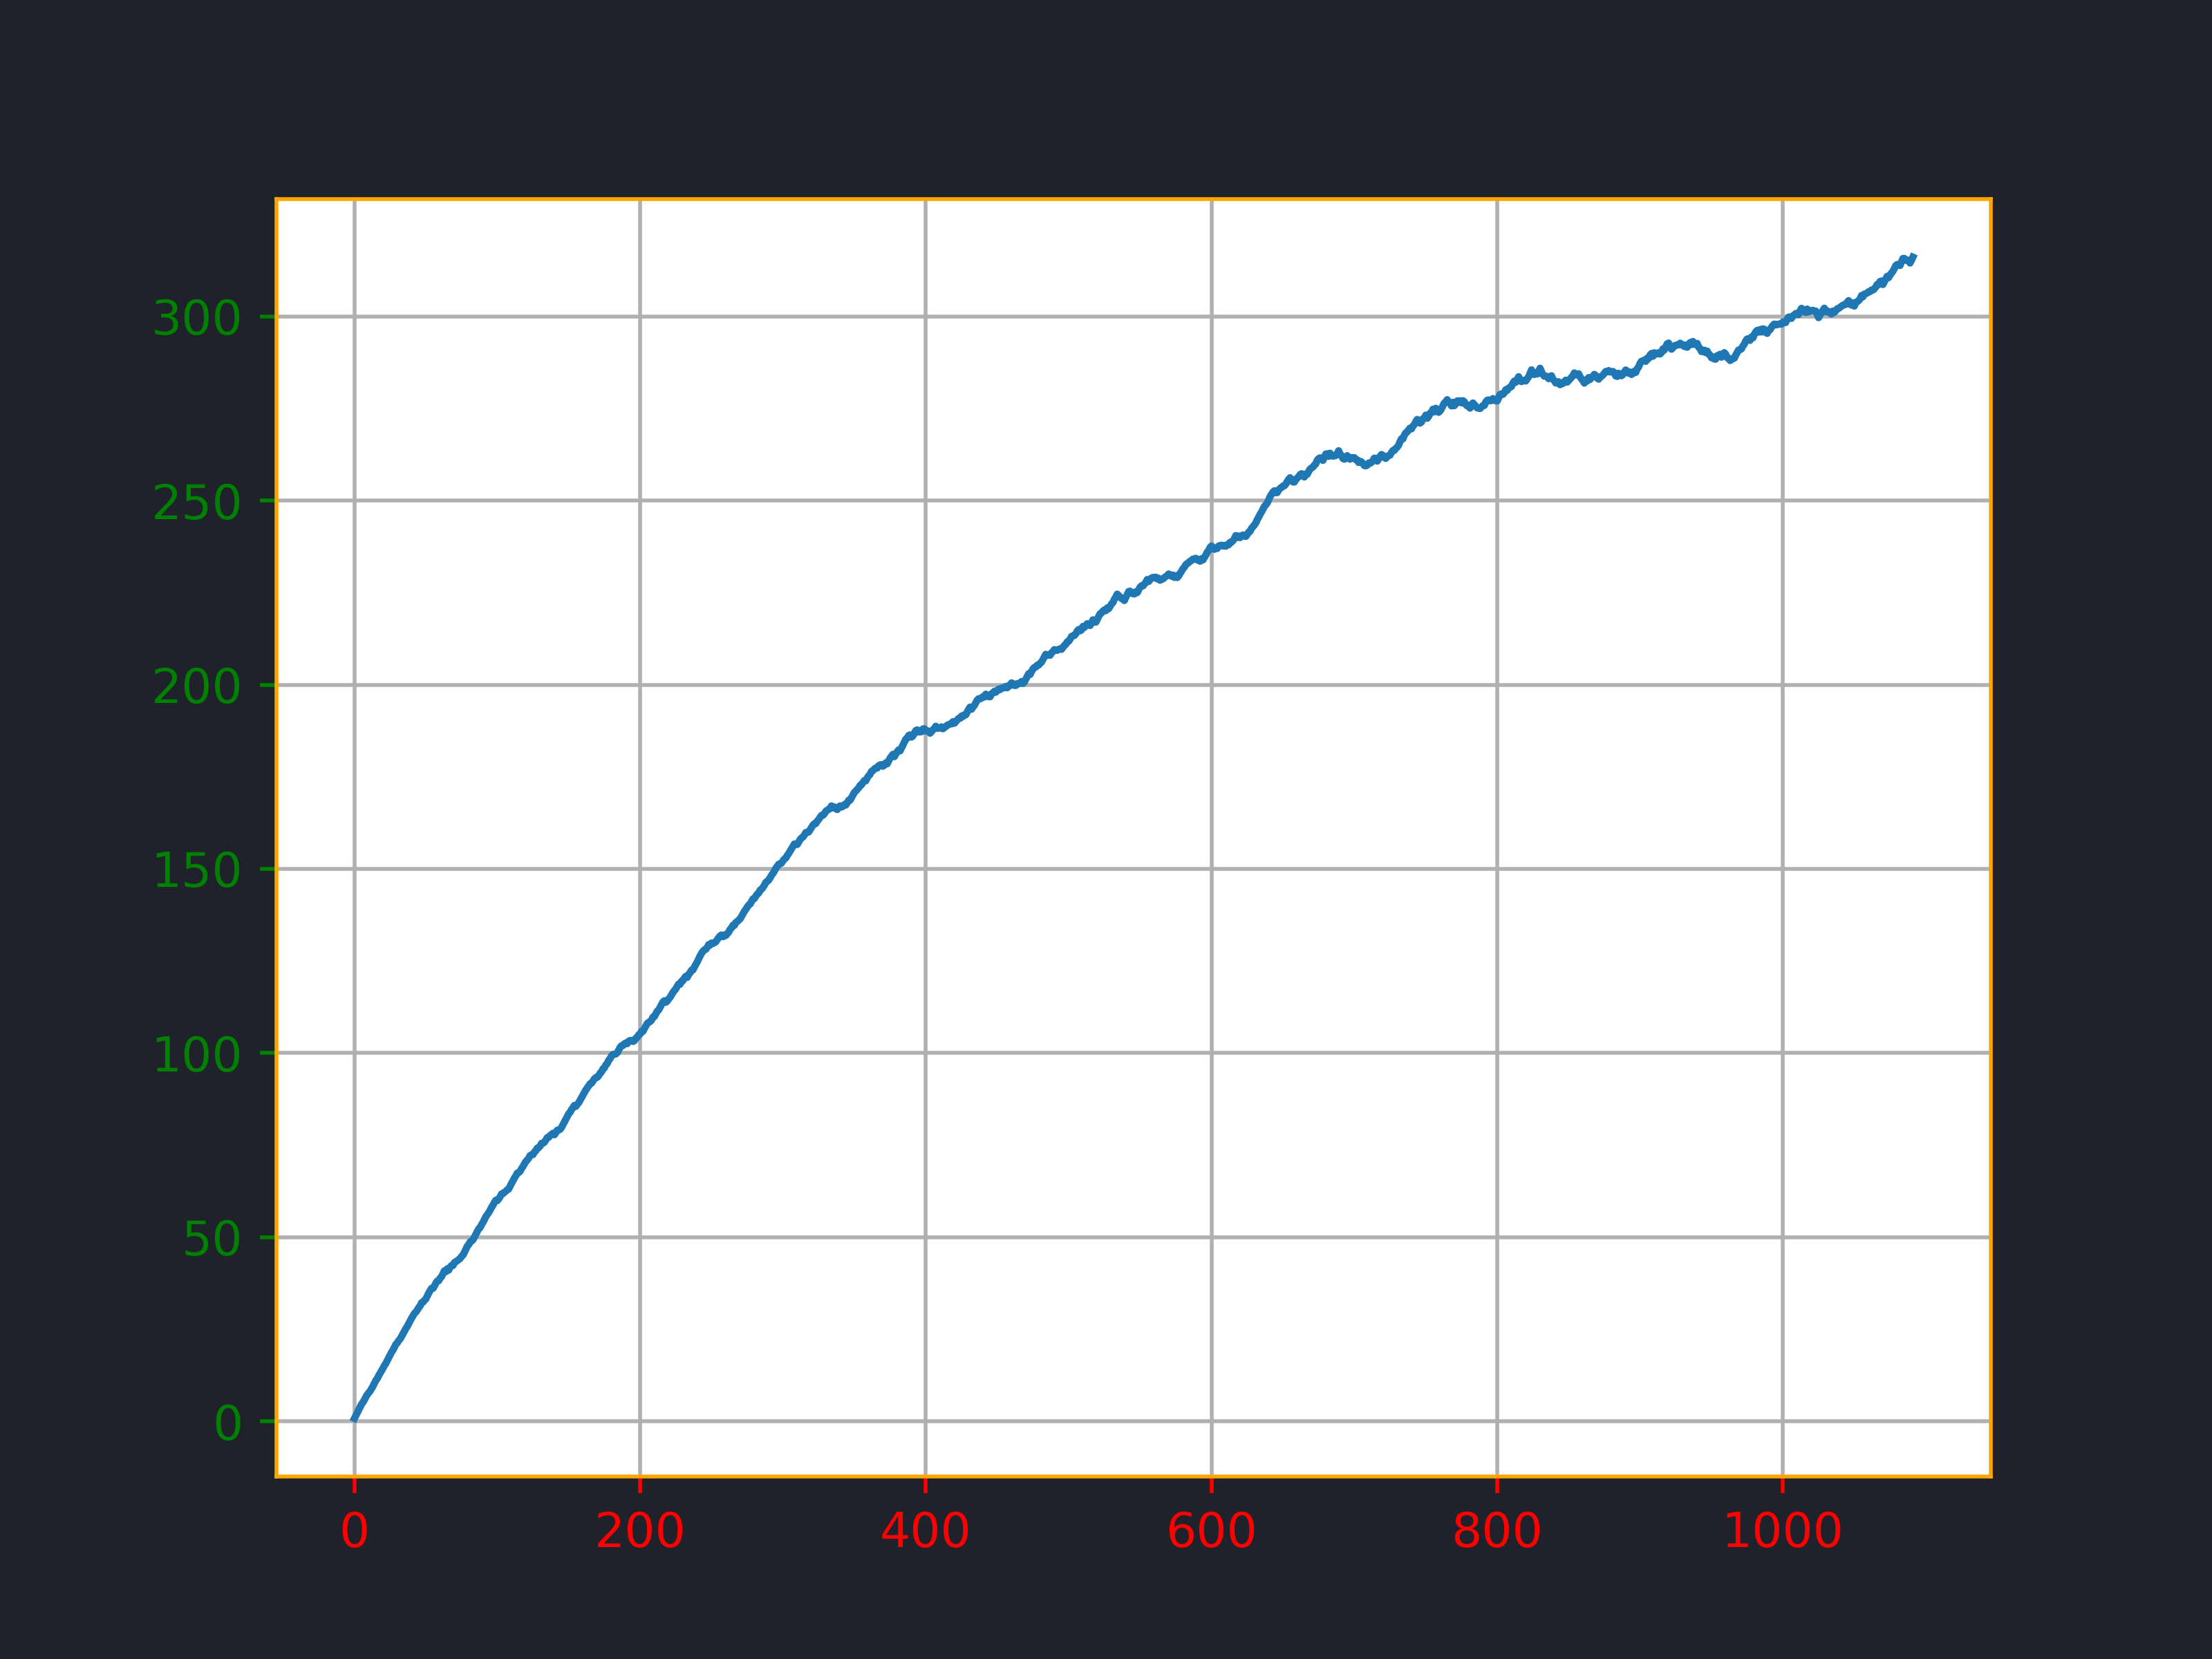
This time, it’s quite similar to the first graph, except the values are hopefully more meaningful, e.g. if i were to only earn a few points in a row, that would likely translate into negative points once rectified and thus we would see a negative slope rather than a positive one with the official MK8 VR system.
My score deltas⌗
Another thing that can be nice to investigate is the distribution of my score deltas.
What is a score delta? Here, it’s simply the difference between two consecutive VR snapshots, i.e. the amount of points i loose or gain after a given race.
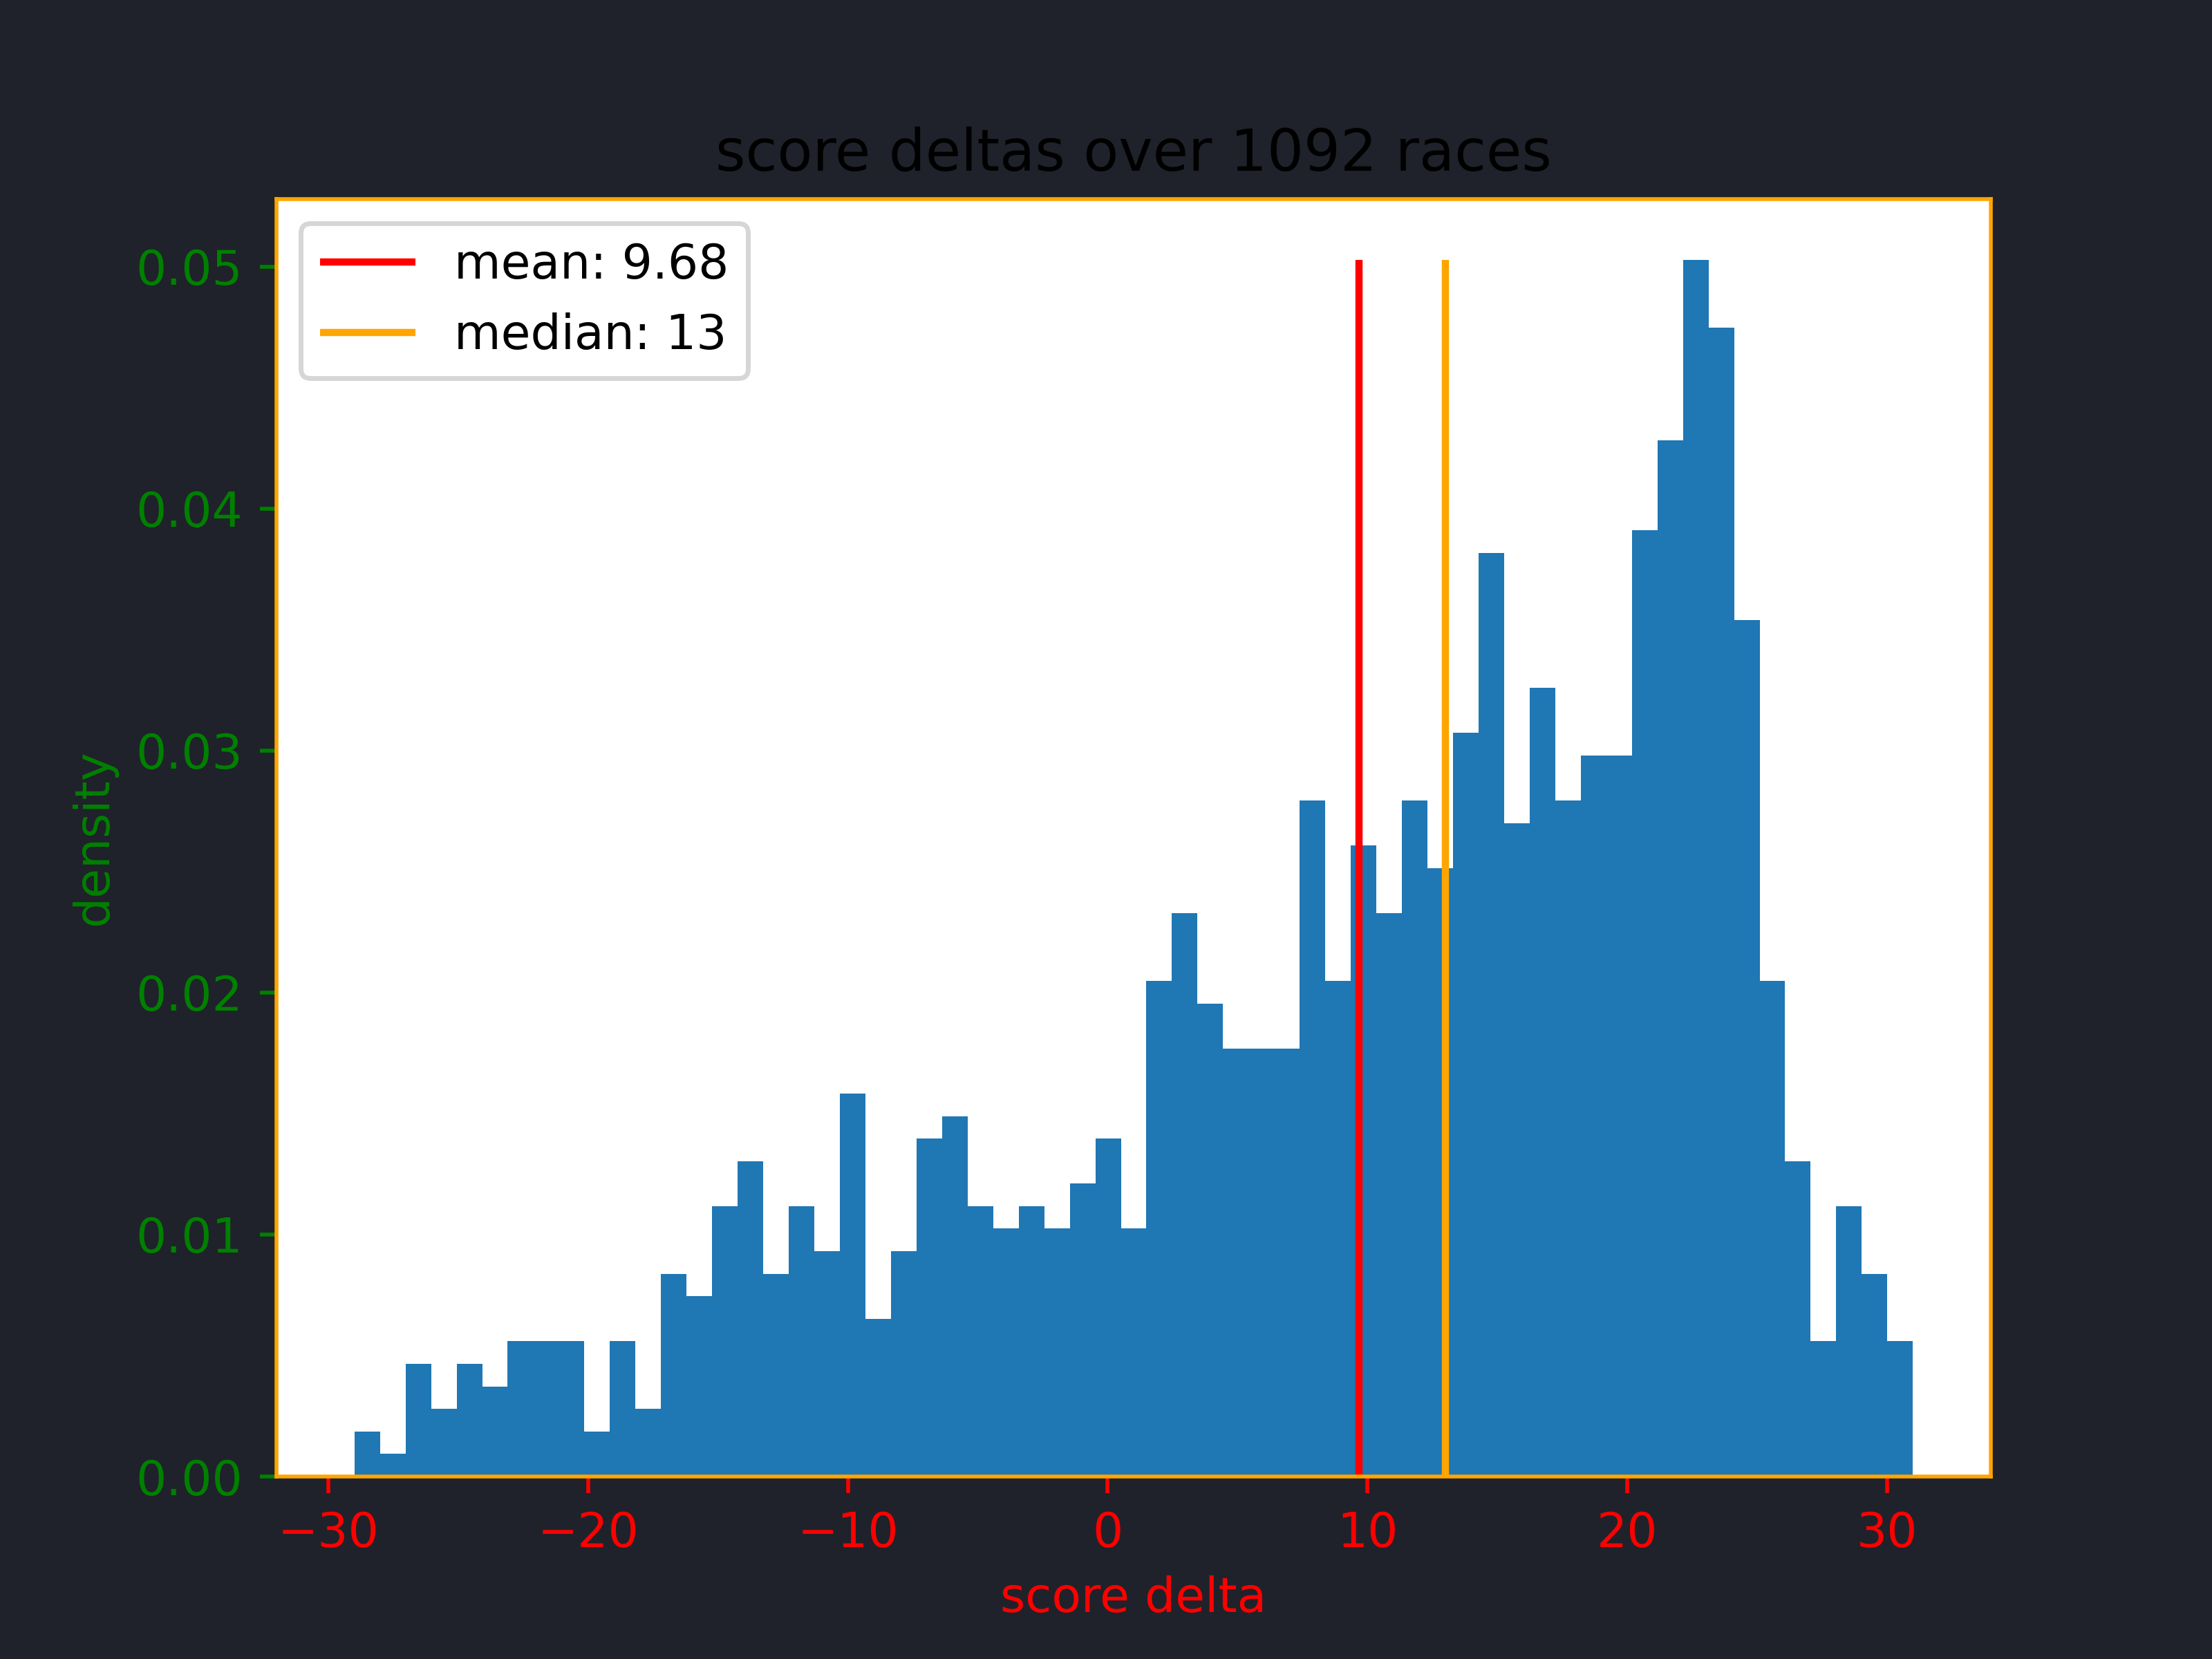
And here is the evolution of the deltas distribution over time:
-------------------------------------------